
A picture of wealth inequality across EU Member States
Published: 15 September 2025
Related: 2 publications
Wealth inequality across EU Member States has important implications for access to education, healthcare and housing, as well as for people’s ability to actively participate in society.
This article summarises some of the main findings from the recently published report Unequal wealth: Exploring socioeconomic disparities across the EU. It maps wealth inequalities across EU Member States by drawing on data from the European Central Bank’s Household Finance and Consumption Survey (HFCS), covering the period between 2010 and 2021.
There are significant disparities in the extent of wealth inequality across EU Member States, according to the latest available data from 2021 (Figure 1). Wealth tends to be very unequally distributed, as reflected by the Gini index values ranging from 72.6 in Germany to 50.8 in Slovakia (the Gini index is a well-known measure of inequality, ranging from 0 – complete equality – to 100 – maximum inequality). By comparison, income inequality is considerably lower, with Gini values between 38 to 20, as highlighted in a recent Eurofound report).
The highest levels of wealth inequality are found in Germany, Spain and Ireland. The rest of the 10 most unequal countries are, with the exception of Estonia, all EU-15 countries (Member States that joined the EU before 2004):France, Austria, Netherlands, Finland, Italy and Luxembourg.
By contrast, the lowest levels of wealth inequality are observed in Slovakia, Poland and Czechia. The remaining countries in the group of 10 with the most equal distributions are either in central and eastern Europe or in the Mediterranean: Malta, Greece, Slovenia, Lithuania, Hungary, Croatia and Cyprus. All of them, except Greece, are Member States that joined the EU after 2004.
Wealth concentration becomes particularly more visible when comparing the shares of wealth owned by different groups. The richest 5% of the population hold more than 40% of the total wealth in Estonia, Spain and Germany, between 30% and 40% in most countries, and at least 25% even in the most equal country, Slovakia. Meanwhile, the poorest 50% of the population hold only 4% of total wealth in Germany, around 10% in most countries and a maximum of 17% in Slovakia.
Net wealth inequality and wealth share by wealth percentile, Member States, 2021
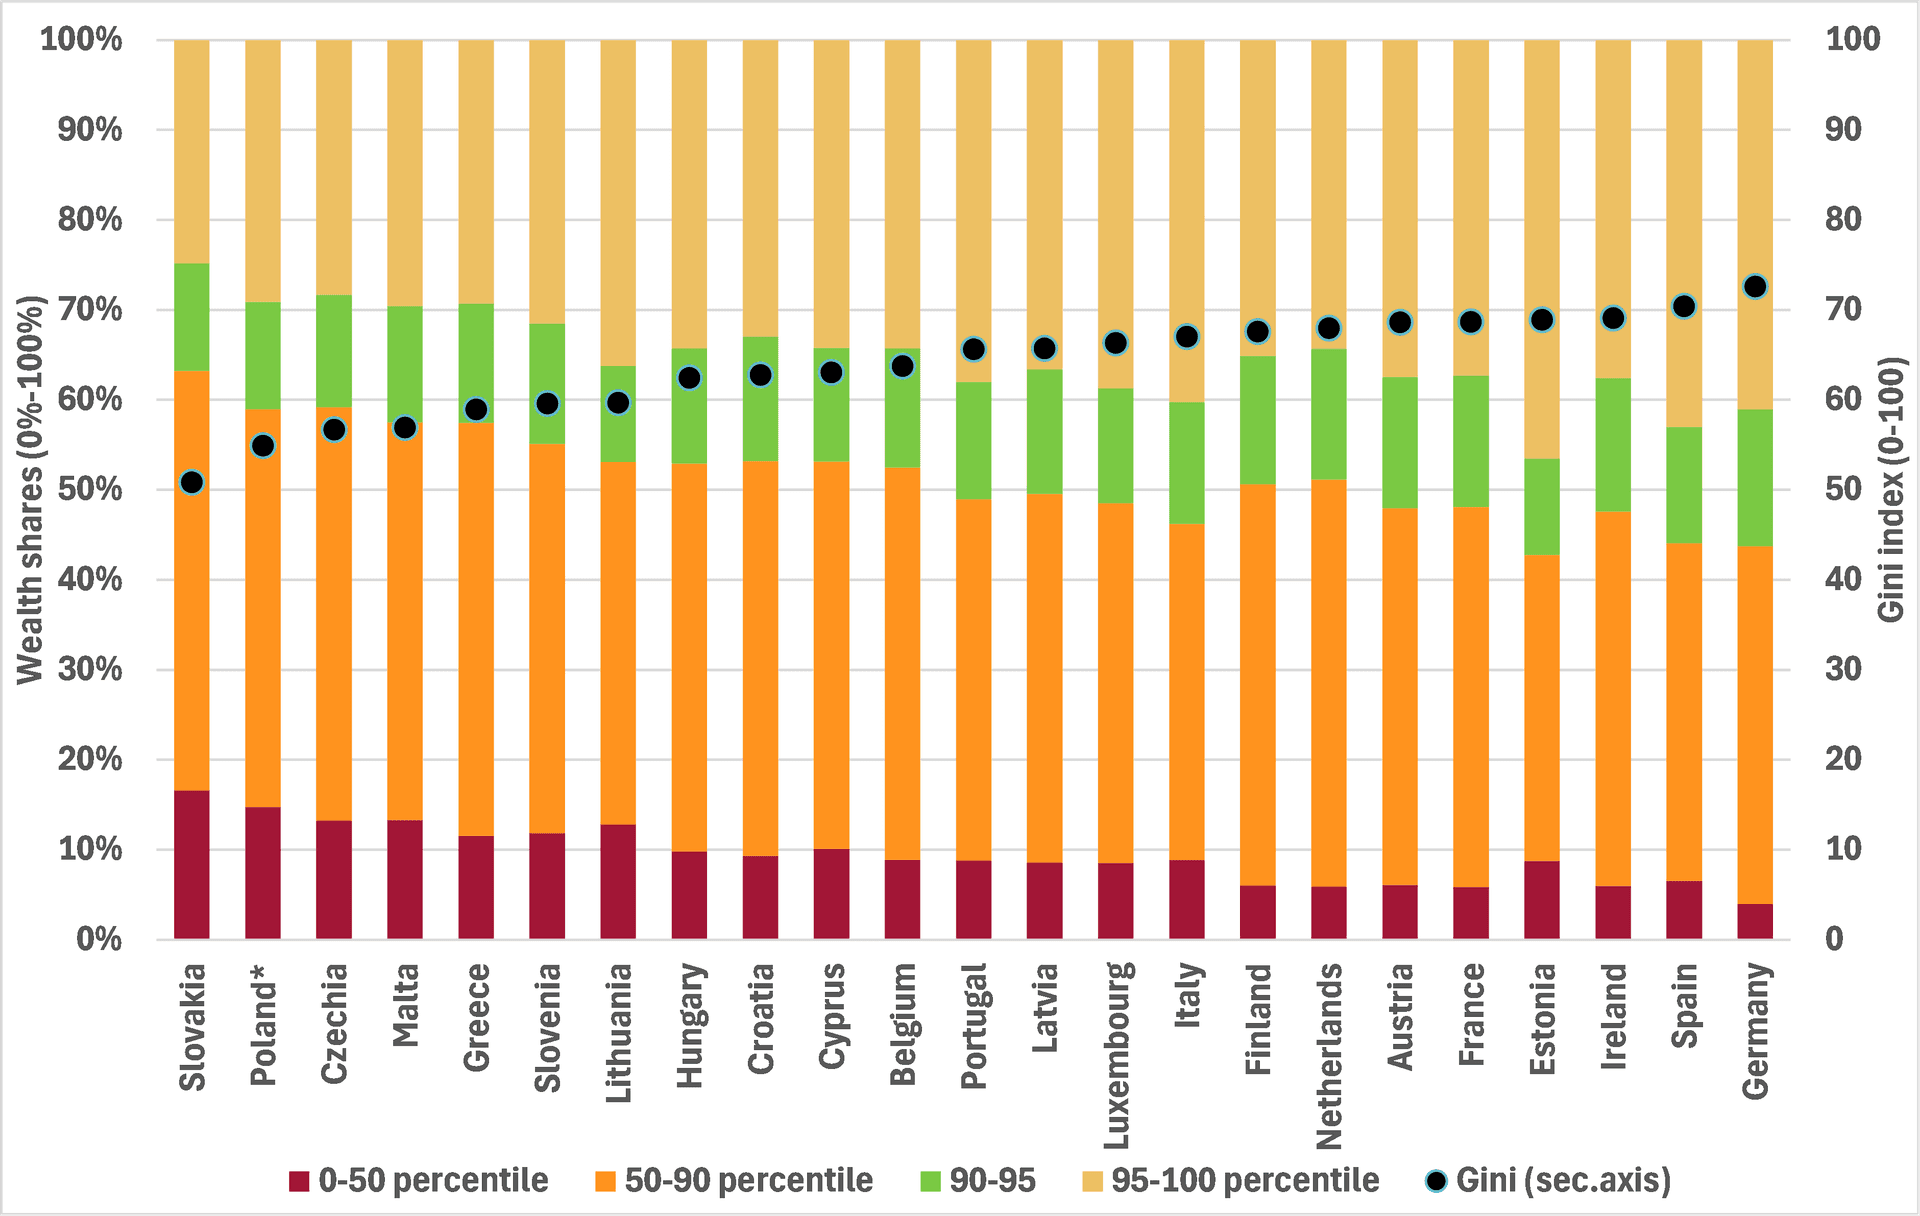
Countries are ranked from lowest to highest level of wealth inequality (data for Poland refers to 2017 instead of 2021) as measured by the Gini index, which ranges from values of 0 (maximum equality) to 100 (maximum inequality). The bars show the wealth shares of certain percentiles of the wealth distribution. For example, the red sections show the wealth shares of the bottom 50% of the population in the total net wealth of the country.
Source: HFCS 2021 (2017 for Poland)
How has wealth inequality evolved across EU Member States between 2010 and 2021? A mixed picture emerges. Inequality increased in 9 countries and declined in 13 (Figure 2, countries above the diagonal line represent inequality increases, and vice versa).
In some Member States, inequalities increased significantly and consistently over time, notably in Spain, Finland and Estonia. In others, the increases were significant but less consistent: in Greece and Slovakia, inequality grew between 2010 and 2017 but then moderated between 2017 and 2021; in Slovenia and Italy, higher inequality stemmed from sudden increases in specific periods – between 2010 and 2014 in Slovenia, and between 2017 and 2021 in Italy. In Belgium and Croatia, the changes were negligible and reflected no clear trend.
Among the countries where wealth inequalities declined, several experienced a sustained downward path: Latvia, Ireland, Austria, Poland, Germany and Luxembourg. In Cyprus, the Netherlands and Hungary, the decline occurred mainly between 2017 and 2021, offsetting earlier increases in inequalities. In Malta, Portugal, Lithuania and France, inequality fell only slightly, with no consistent trend over the period.
It is also interesting to note that a significant process of convergence in wealth inequality levels has taken place across EU Member States. Inequality surged in some of the most equal countries at the beginning of the period, such as Slovenia, Greece and Slovakia, while it fell in some of the most unequal countries initially, including Latvia, Ireland, Germany, Austria and the Netherlands.
Net wealth inequality, EU Member States, 2010 and 2021 (Gini index)
Years other than 2010 and/or 2021 are used in some countries due to data unavailability (2014 instead of 2010 in Estonia, Hungary, Ireland, Latvia and Poland; 2017 instead of 2010 in Croatia and Lithuania; 2017 instead of 2021 in Poland). The black line represents the 45° line of equal proportionality.
Source: HFCS 2010 and 2021
Housing wealth plays the largest role in shaping overall wealth inequality. In 2021, housing net wealth accounted for 63% of total net wealth on average across EU Member States. This means that disparities in housing wealth explain the largest proportion of overall inequality levels across virtually all Member States. Among the countries where wealth inequality increased the most between 2010 and 2021 – Slovenia, Spain and Greece – widening housing wealth disparities were the main driving force.
At the same time, housing can also moderate overall wealth inequality levels. Homeownership can act as a buffer against economic insecurity and prevent even higher disparities. Although unevenly distributed, housing wealth is generally less unevenly distributed than non-housing wealth. This explains why countries with high homeownership rates tend to show lower wealth inequality levels (Figure 3).
Among the six Member States with homeownership rates above 80% – all of them newer Member States that joined the EU after 2004 – five also record some of the lowest levels of wealth inequality (Slovakia, Malta, Slovenia, Lithuania and Hungary). Conversely, in four western European countries with the lowest homeownership rates – Germany, Austria, France and Netherlands – wealth inequality is among the highest. In brief, high homeownership rates are linked to lower levels of inequality in housing wealth, which in turn translates into lower overall wealth inequality.
Relationship between net wealth inequality and homeownership rates, Member States, 2021
The correlation coefficient between the two variables is 0.46.
Source: HFCS 2021
Housing affordability is a particularly pressing issue for younger Europeans. Rising housing costs relative to income are delaying their transition to independent living. They are disproportionately affected by higher rental prices, while access to homeownership is becoming increasingly difficult.
In this context, housing policies that improve access to affordable renting or ownership could help ease pressures. Examples include subsidies for low-income renters, investments in social housing and incentives for building affordable rental housing.
Beyond housing, other policies could also help moderate wealth inequalities. These include introducing wealth declarations in combination with progressive wealth taxation, promoting financial literacy and designing comprehensive policy packages targeted at middle- and low-income households.
Overall, Eurofound findings from the report on Unequal wealth: Exploring socioeconomic disparities across the EU highlight large cross-country differences in wealth inequality across EU Member States, alongside mixed trends over the past decade. Housing disparities play a central role, but homeownership can also moderate overall inequality levels. Looking ahead, improving housing affordability and ensuring fair access to wealth-building opportunities will be crucial for ensuring inclusive growth across Member States.
Eurofound recommends citing this publication in the following way.
Eurofound (2025), A picture of wealth inequality across EU Member States, article.
