AI is already in use in Europe’s workplaces, but not at the expense of young workers
Data: 5 figures
The rapid adoption of AI over the last few years has prompted debate over whether the technology is weakening employment outcomes for young people. This article examines the evidence across the EU27 by comparing labour market outcomes for young and prime-age workers between 2011 and 2025, while distinguishing actual generative AI use from potential exposure to it.
Set against the background of the post-pandemic recovery, recent developments in hiring are broadly in line with cyclical labour market dynamics. Hiring was strong in 2022, at the peak of the rebound, and shows a progressive normalisation thereafter (Figure 1). The youth hiring rate, which counts everyone aged 15 to 29 in a job they had started within the previous 12 months as a share of all people in that age group, whether in the labour force or not, ran at 16.5% in 2019; it rose to 17.9% in 2022 and fell to 15.9% in 2025. The prime-age rate followed the same path, from 9.6% in 2019 to 10.2% in 2022 and 8.9% in 2025. For young workers, the swings are wider in both directions, consistent with their greater responsiveness to the cycle, but the profile is the same for both age bands: strong job creation through 2022, followed by a cooling that has left both rates modestly below their pre-pandemic levels, by 3.5% for young people and 7.4% for prime-age workers.
Unemployment is the one area in which the young have lost ground relative to those of prime working age (Figure 2). Both groups end 2025 with a lower unemployment rate than in 2019, but the prime-age rate fell much further. The youth unemployment rate moved from 11.97% to 11.73% and the prime-age rate fell from 5.99% to 5.09%. Indexed on each group’s own 2019 value, young people stand at 98 in 2025 while the value for those in the prime age category is 85. Two separate phases can be distinguished in Figure 2. First, the pandemic pushed youth unemployment up 12.5% compared with 5.6% for those of prime working age; this gap never recovered in the aftermath of the pandemic. Second, since 2023, the unemployment rate of prime-age workers has continued to fall while the youth rate climbed back towards its 2019 level. Set against the pre-pandemic trend when the two series moved almost in step, the increasing divergence in the series after 2020 is noteworthy.
Within the young cohort, the cooling of the labour market is not specific to graduates. Those with a tertiary education end 2025 in the strongest position of the three educational attainment groups: theirs is the only employment rate above its 2019 level, up 3.0%, while their unemployment rate sits 1.7% below its 2019 level (Figure 3). Furthermore, those with a medium level of education hold their 2019 position almost exactly across all three indicators, with their employment rate unchanged and their unemployment rate marginally lower. The deterioration in employment rate is concentrated in the group with a low level of education: their employment rate fell 4.1% below its 2019 level, almost all of it in 2025, and their unemployment rate is the only one to end the period above its pre-pandemic level.
Labour market position of young people aged 15–29 by educational attainment, EU27, 2019–2025, indexed values
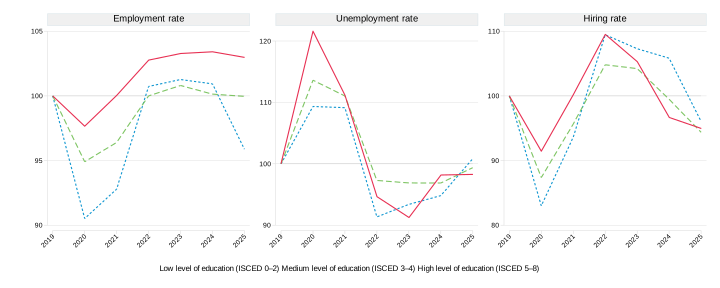
Notes: Index for 2019 = 100. Each panel indexes the three attainment groups relative to their own 2019 value. ISCED 0–2 corresponds to less than primary, primary and lower secondary education; ISCED 3–4 corresponds to upper secondary and post-secondary non-tertiary education; ISCED 5 and above corresponds to tertiary education, including short-cycle tertiary, bachelor’s, master’s and doctoral programmes. The employment rate is the percentage of employed people as a share of the population; the unemployment rate is the percentage of unemployed people as a share of the labour force; the hiring rate is the number of people who have started a job within the previous 12 months as a share of the population. Workers whose start date in a job is not recorded are counted in the population but not among recent hires, so hiring levels are slightly understated.
Source: Author, based on EU-LFS extractions; EU27 aggregate.
Employment in the EU27 is shifting towards the occupations where AI is actually used, and the shift is common to both age groups (Figure 4). Between 2019 and 2025, the number of young employees in high-use occupations (see note to Figure 4 for how these occupation groups are defined) rose by 16.4%, from 9.07 million to 10.6 million, while prime-age employment in the same occupations rose by 15.0%, from 30.7 million to 35.3 million. At the other end of the distribution, both groups shed employment: low-use occupations lost 7.2% of their young employees and 11.4% of their prime-age employees over the same period. The occupations characterised by a medium use of AI sit between the two groups: youth employment there rose by 1.2% while prime-age employment fell by 4.4%. This pattern predates the use of generative AI. Employment in high-use occupations had been climbing for both young and prime-age employees since 2013, when it stood at 86% of its 2019 level for the young and 92% for those of a prime working age. Rather than marking a break with the trend, the years after 2022 therefore continue a structural shift in employment – under way for more than a decade – towards occupations that are more likely to use AI.
Occupational AI use by employees aged 15–29 and 30–49, EU27, 2011–2025, indexed values
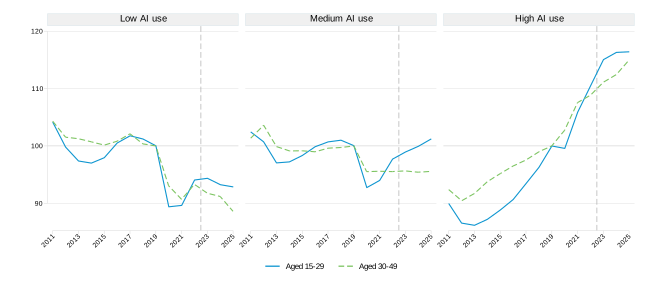
Notes: Index for 2019 = 100. The dashed vertical lines indicate the release of ChatGPT in November 2022. Occupations are ranked by the share of workers reporting that they had used an AI-powered tool in their main job in the previous 12 months, as measured in the AIM-WORK survey conducted by the European Commission’s Joint Research Centre (JRC). They are divided into three groups of roughly equal employment size, using employment before 2022, so each group contains about a third of all employees rather than a third of all occupations. Low, medium and high AI use refer to the proportion of workers in that occupation who use AI. Examples of occupations that report high AI use are information and communications technology professionals and business and administration professionals. The medium use group includes science and engineering associate professionals, health professionals and sales workers. The low use group includes personal service workers, drivers, mobile plant operators and building trades.
Source: Author, based on EU-LFS extractions; JRC AIM-WORK survey 2024–2025; EU27 aggregate.
Figure 5 unpacks the hiring trends for young and prime-age workers across the three different groups of AI use. Each line captures the share of the age band’s hires that took up a job in that group in the previous 12 months. The three shares sum to 100 for each band while the two bands are directly comparable. The figure shows that, since 2011, the occupation mix has shifted steadily towards occupations where AI is used. Among young people, the share of new hires entering high-use occupations rose from 23.1% in 2011 to 27.7% in 2019 and 30.3% in 2025, while the share entering low-use occupations fell from 35.5% in 2011 to 29.4% in 2025. A similar pattern emerges for prime-age workers: between 2011 and 2025, the percentage rose from 25.8% to 34.8% in the high-use group and fell from 42.1% to 32.8% in the low-use category. However, the figure also shows a drop in two areas. Young people are less concentrated than prime-age workers in jobs where AI is used: in 2025, 30.3% of hires in these jobs were young people, while 34.8% were aged between 30 and 49. And since 2022, the share of young hires going to high-use occupations has edged down by 0.7 percentage points while the share going to medium-use occupations has risen by 1.3 points.
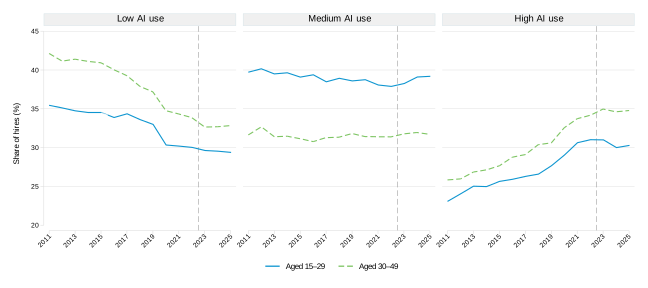
Notes: ‘Hires’ refer to people who have been in their job for 12 months or less. The dashed vertical lines indicate the release of ChatGPT in November 2022. Occupations are ranked by the share of workers reporting that they had used an AI-powered tool in their main job in the previous 12 months, as measured in the AIM-WORK survey. They are divided into three groups of roughly equal employment size, using employment before 2022, so each group contains about a third of all employees rather than a third of all occupations. Low, medium and high AI use refer to the proportion of workers in that occupation who use AI. AI use ranges from 1.3% to 17.2% of workers across the occupations in the low-use group, from 17.4% to 36.7% in the medium-use group, and from 36.9% to 58.8% in the high-use group.
Source: Author, based on EU-LFS extractions; JRC AIM-WORK survey 2024–2025; EU27 aggregate.
This section provides information on the data contained in this publication.
5 figures related to this publication are available for preview.
Eurofound recommends citing this publication in the following way.
Eurofound (2026), AI is already in use in Europe’s workplaces, but not at the expense of young workers, article.
Reference no.
EF26055
Activity